China AI data centers, in IEA numbers — not a brochure TAM

XXXFuel Editors
10 min read
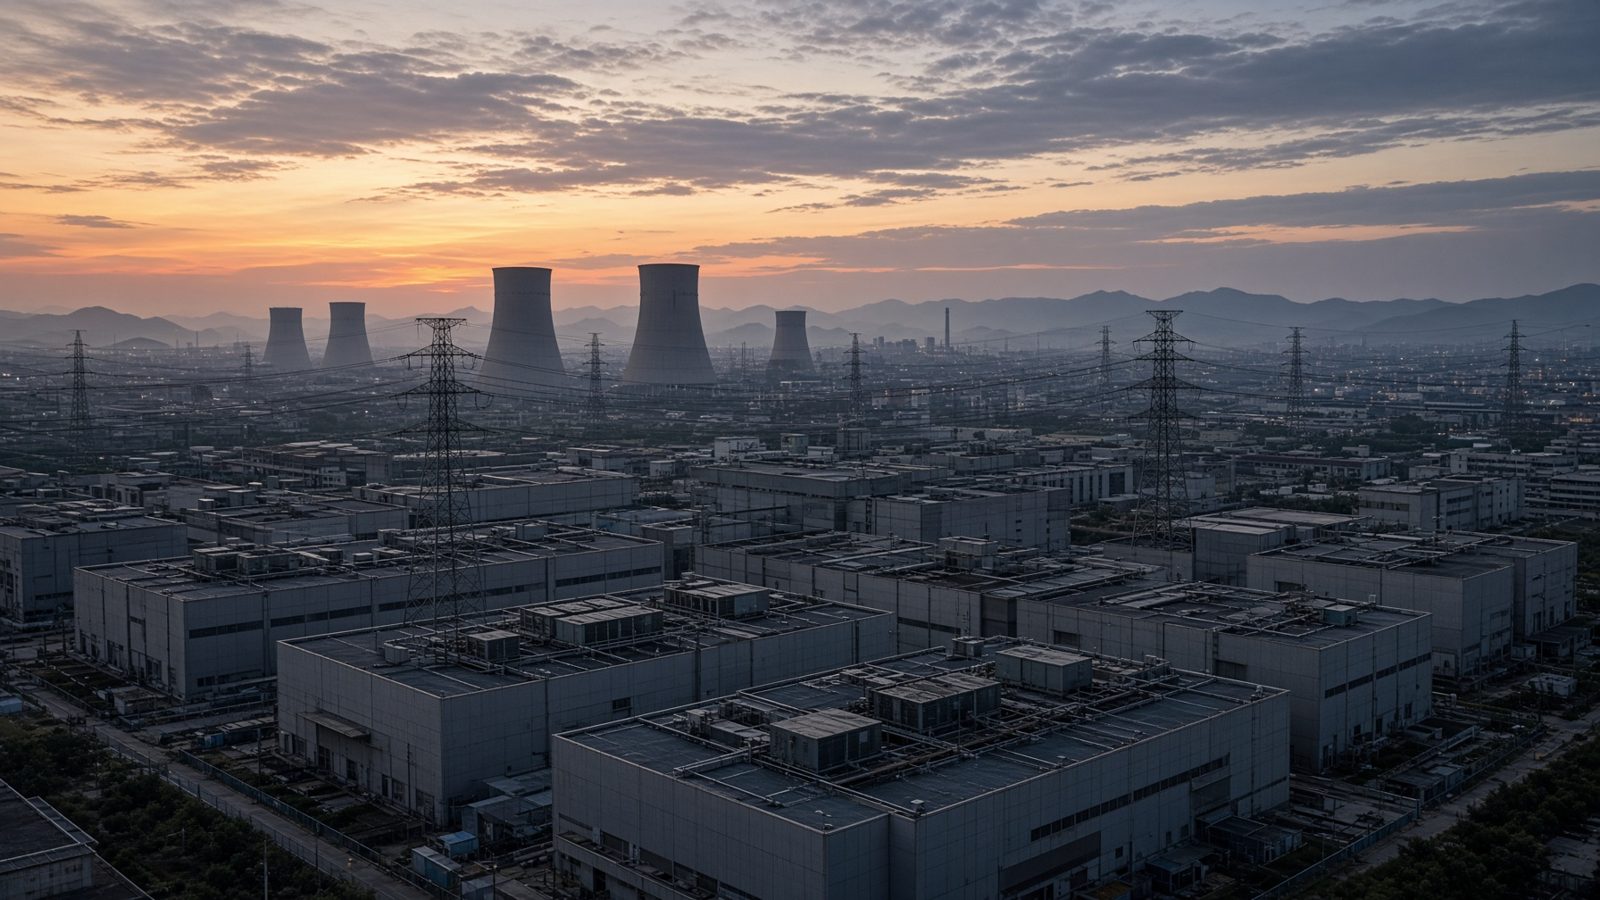
China used about 25% of world data-center electricity in 2024 (~104 TWh) and adds ~175 TWh by 2030. Coal still ~70% where the load sits.
Unit: TWh
IEA: China was ~25% of 415 TWh in 2024 (~104 TWh). Consumption rises ~175 TWh (~+170%) by 2030. US + China are ~80% of world DC growth to 2030.
Start with power, not with a consultant’s CAGR. The IEA’s Energy and AI work is the least-wrong public census we have: data centers used about 415 TWh worldwide in 2024 (~1.5% of world electricity). China accounted for about 25% of that, the United States 45%, Europe 15%. Twenty-five percent of 415 is about 104 TWh in China in 2024. The same report says China and the United States together deliver nearly 80% of global data-center electricity growth to 2030, with China’s consumption up about 175 TWh, or ~170%, over 2024. That math lands near 279 TWh in 2030 if the base case holds. Those are the numbers this page will not negotiate.
What we will not do: recycle an unsourced “$10.4 billion in 2025 / $60–70 billion in 2033” AI-data-center revenue print. It appeared in earlier drafts of this desk and in vendor slides across the internet. We could not pin it to a primary report we can show you. It is out. In its place: IEA terawatt-hours, IEA fuel mix, a Technavio figure that is actually an increment, and the project-count reporting Brookings summarized from state sources.
Electricity: the IEA path
| Fact | Figure | Source |
|---|---|---|
| World DC electricity, 2024 | 415 TWh (~1.5% of world) | IEA Energy and AI |
| China share, 2024 | ~25% (~104 TWh) | IEA executive summary |
| US share, 2024 | ~45% | IEA |
| China growth 2024→2030 | +~175 TWh (~+170%) | IEA Energy demand from AI |
| US growth 2024→2030 | +~240 TWh (~+130%) | IEA |
| US + China share of world DC growth to 2030 | ~80% | IEA |
| World DC electricity, 2030 base | ~945 TWh | IEA |
Later IEA updates have talked about world DC load around 485 TWh in 2025 doubling toward ~950 TWh in 2030. That is the same family of numbers, refreshed. It does not reverse the China slice. If a slide in your inbox still says “China will overtake the US on AI compute this year,” ask for the unit. Capacity, utilization, and electricity are three different races. On electricity, the US is still larger; China is growing faster in percentage terms from a smaller 2024 base.
Fuel mix: coal is still the eastern default
IEA’s Energy supply for AI chapter is explicit: because so much of China’s data-center load sits in the east of the country, the electricity mix feeding it is about 70% coal, nearly 20% renewables, close to 10% nuclear, gas the rest. Between 2024 and 2030, coal remains the largest additional source for these halls (~+90 TWh), and renewables add a similar ~90 TWh, helped by western-siting policy and provincial co-location rules. After 2030, IEA’s base case has renewables and nuclear together approaching ~60% of China data-center supply by 2035, with coal rolling over. That is a 2030s story, not a 2026 one. Anyone selling “green AI in China” as a present-tense average is averaging the west and hoping you do not look east.
| Period | What IEA says about China DC supply |
|---|---|
| Today (eastern-heavy siting) | ~70% coal, ~20% renewables, ~10% nuclear |
| 2024–2030 additions | Coal +~90 TWh; renewables +~90 TWh |
| 2030–2035 | Renewables + nuclear rise; coal into decline in the base case |
| 2035 | Renewables + nuclear ~60% of DC supply in that case |
East trains. West is supposed to infer.
Policy intent is not a mystery. Coastal provinces still have the international cables, the talent, and the existing substations, so large training campuses keep showing up there. Inland and western provinces are where cheaper power and co-location-with-renewables rules are supposed to pull inference and rendering. Some of that is happening. Some of it is a press release in front of a coal plant. Utilization is the tell: empty halls in energy-rich provinces have already been a Chinese-language news story, and MIT Technology Review has covered the “built it, didn’t fill it” pattern. A tender is not a cluster. A cluster is not a watt.
Brookings, summarizing state reporting, noted over 500 data-center infrastructure projects announced in 2023–2024, with at least 150 running by the end of 2024. Announcements outrunning operations is not unique to China. It is unusually well documented there. Treat the 500 as a pipeline, the 150 as a floor on what was actually live in that telling, and neither as a megawatt total.
The dollar figures we are willing to print
Technavio’s China data-center market note (the whole market, not a pure “AI hall” cut) says the market size is valued to increase by $67.7 billion at an 18.3% CAGR from 2025 to 2030, with about 15.5% year-on-year growth in 2025–26. That is an increment over a period, not a 2025 revenue stock. Grand View’s global AI data center cut is a different animal: $147.3 billion in 2025, with China “holding a dominant share” in that firm’s 2025 regional split — they do not give us a China-only dollar total we can responsibly reprint as a point estimate. Global investment in data centers, IEA says, was about half a trillion dollars in 2024. China is inside that pile. We will not subdivide it without their table.
| Scope | Use it for | Do not use it for | |
|---|---|---|---|
| IEA 104 → ~279 TWh | China DC electricity 2024 / 2030e | Grid and climate arguments | Vendor TAM slides |
| Technavio +$67.7B, 2025–30 | China data-center market growth | Order of magnitude of spend | “The market is $67.7B this year” |
| Grand View $147.3B (2025) | Global AI data-center market | World TAM | China-only revenue |
| IEA ~$0.5T capex, 2024 | Global DC investment | How hot the cycle is | A China percentage we were not given |
| 500 announced / 150 running (2023–24) | Projects, not MW | Pipeline vs operations | A utilization rate |
Chips, export controls, and gallium
The accelerator mix inside Chinese halls is no longer “NVIDIA or nothing.” Huawei, Cambricon, Biren, and a long tail of CUDA-incompatible silicon show up in tenders. That is observable. What is not observable from the outside is a clean FLOP total we trust. Export controls change which chips arrive, not whether coastal utilities see load. IEA also flags a supply-chain fact that belongs in this story even though it is not a TWh: China accounts for about 99% of refined gallium, and data-center demand for gallium could exceed 10% of today’s supply by 2030. AI energy security is not only “who has the gas turbine.” It is also “who refines the weird metals in the power electronics.”
How to read the next China AI-infrastructure slide
- Is the unit TWh, MW, number of campuses, or dollars?
- Is “AI data center” defined, or is it every hall that might one day hold an accelerator?
- Is the fuel mix eastern present-tense (~70% coal) or western 2035-tense?
- Is the dollar figure a stock, a multi-year increment, or a global TAM with “China is important” taped on?
- If they cite a 2033 revenue hockey stick, ask for the PDF page. We asked. We dropped ours when the page was missing.
The industrial story is still real: China is the second-largest data-center electricity consumer on Earth, growing faster in percentage terms than the US, still coal-heavy where the load actually sits, trying to drag new halls west, and substituting domestic accelerators under export control. That sentence is sourced. A $70 billion 2033 “AI DC market” is a brochure until someone shows the table.
Export controls change the mix, not the megawatts
US and allied export rules throttle the newest NVIDIA parts. They do not throttle air conditioners. A campus that cannot buy B-series accelerators still connects to the grid if the local government wants the ribbon-cutting. What you get instead is a messier rack: last-generation parts, Huawei and Cambricon, more servers per FLOP, sometimes worse utilization. That can raise TWh per useful token in the short run. It is one reason IEA’s China electricity path can keep rising even when Western observers insist “they can’t get the chips.” They can get enough chips to pull 175 extra TWh in the base case. The chips are just not the ones on a keynote slide.
Software is the tax. CUDA-incompatible silicon is real in tenders and painful in production. That pain is why coastal training still hunts for whatever NVIDIA inventory exists, and why western “inference parks” can sit under-filled. MIT Technology Review’s reporting on unused Chinese AI data centers is the footnote that belongs under every 500-project press release: building is a political success metric; filling is an engineering one.
Water, land, and the part that is not TWh
We have a cleaner water dataset for the United States and Ireland than for China. The responsible sentence is therefore modest: a large share of Chinese data-center capacity sits in water-stressed regions (academic reviews have put a high fraction of China’s DC capacity in water-scarce basins). Coastal humidity and inland aridity are different cooling problems. Do not import a Virginia peaking factor into Gansu and call it a study. Do not ignore water because the IEA table is about coal.
Sources
- IEA, Energy and AI — Executive summary (415 TWh; US 45%, China 25%, Europe 15%).
- IEA, Energy demand from AI (US +~240 TWh / +130%; China +~175 TWh / +170%; ~80% of world growth).
- IEA, Energy supply for AI (China DC mix ~70% coal, ~20% renewables, ~10% nuclear; 2024–30 additions; 2035 mix).
- Brookings, Global energy demands within the AI regulatory landscape (2026), including the 500 / 150 project counts from state reporting.
- Technavio, China data-center market size note (increase of $67.7B, CAGR 18.3% from 2025–2030; 15.5% YoY 2025–26).
- Grand View Research, AI data-center market (global $147.3B in 2025; China described as a dominant regional share, not a China-only total).
- IEA gallium note in the Energy and AI executive summary (~99% of refined supply; data-center demand could exceed 10% of today’s supply by 2030).
Updated August 2026. Unsourced revenue hockey sticks from earlier versions of this page have been removed on purpose.
Unit: %
IEA Energy supply for AI: eastern siting means coal still dominates. 2024–30 coal and renewables each add ~90 TWh; by 2035 renewables+nuclear approach ~60%.
More from the desk

How to Make an AI Girlfriend: The Actual Build Order
Appearance last. Personality first. Scenario as the memory spine. Then voice, memory, and who actually keeps her. A 2026 build order for Candy, Character.AI, CrushOn, and Nomi — including the free path.
22 min read

Who Owns the AI Character You Just Built?
You spent a night on her. You probably do not keep her. Character.AI, Candy, SpicyChat, Nomi, CrushOn — who actually owns the AI girlfriend you just built, in the terms they already published.
17 min read
Best AI girlfriend apps in 2026
Character.AI, Kindroid, SpicyChat, CrushOn, Replika, Chai, Talkie, Muah, Candy, and Nomi — grouped by what they actually do, with live pricing caveats.
4 min read