AI energy use, in numbers that mean something

XXXFuel Editors
12 min read
Training runs make headlines. Inference is the line item on the grid. IEA, LBNL, Ireland CSO, and query-level watt-hours — with sources.
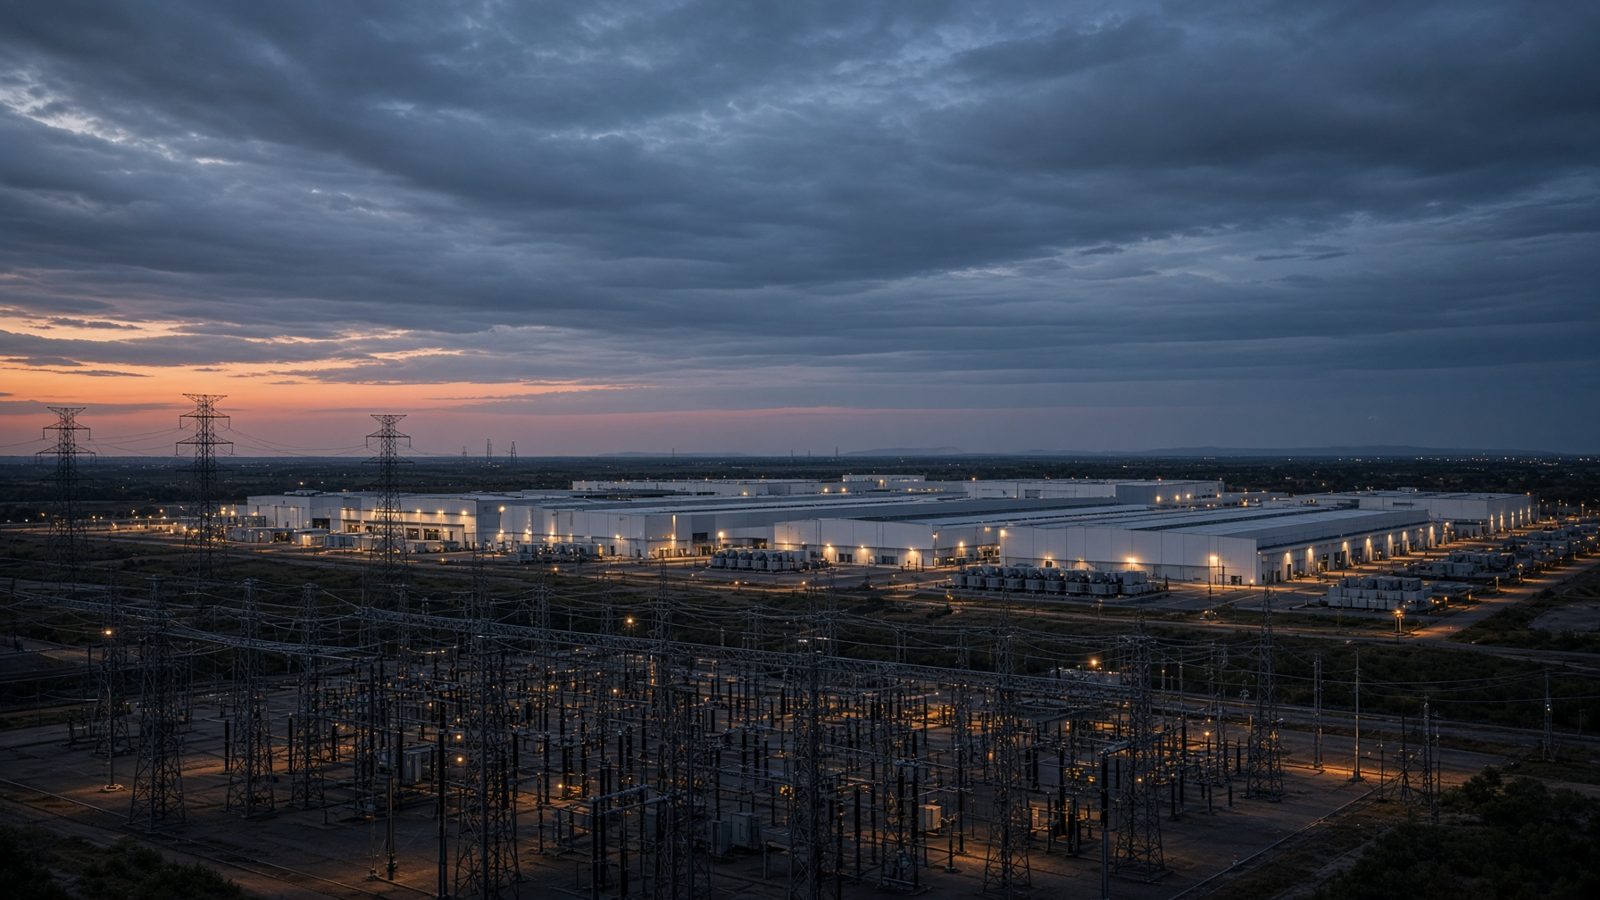
Unit: TWh
IEA Energy and AI, base case. 2024 is an estimate (~1.5% of world electricity). 2030 is ~Japan’s current power use.
A frontier training run can still use as much electricity as a small town burns in a short season. That number is real. It is also the wrong one to obsess over. You train rarely. You infer constantly. The International Energy Agency’s 2025 Energy and AI report is the first public document that treats this as a power-system fact rather than a press-release footnote: data centers used about 415 terawatt-hours (TWh) in 2024, roughly 1.5% of world electricity, and the base case sees that load more than doubling to about 945 TWh by 2030—slightly more than Japan uses in a year today.
That is the frame. Everything else is a fight over ranges, geography, and what vendors leave out of a “this query uses as little as a Google search” sentence.
The numbers that survive a week
Analysts disagree on 2026 and 2035. They do not disagree on the shape. IEA: 12% annual growth in data-center electricity since 2017, more than four times faster than electricity as a whole. Accelerated servers (the AI-heavy ones) grow about 30% a year in the base case; conventional servers about 9%. Goldman Sachs Research has talked about a 160–165% rise in data-center power demand by 2030 versus 2023. Deloitte’s adjacent forecast sits around 1,065 TWh in 2030. The IEA’s longer base case is about 1,200 TWh by 2035.
US-only series are tighter because Lawrence Berkeley National Laboratory, EPRI, and the IEA can see the same interconnect queue. LBNL put 2023 US data-center load around 176 TWh. IEA’s US 2024 print is in the high 180s. The same IEA book has the United States going from about 108 TWh in 2020 to about 426 TWh in 2030. That is not “AI might use some power.” That is nearly half of US electricity-demand growth this decade, and more than aluminium, steel, cement, and chemicals combined by 2030.
| Source | Year | Scope | Electricity | Share / note |
|---|---|---|---|---|
| IEA Energy and AI | 2024 | World data centers | 415 TWh | ~1.5% of world electricity |
| IEA Energy and AI | 2030 base | World data centers | ~945 TWh | Just under 3%; ~Japan today |
| IEA Energy and AI | 2035 base | World data centers | ~1,200 TWh | Uncertainty widens after 2030 |
| Our World in Data / IEA | 2025 | World data centers | ~485 TWh | AI-focused slice ~155 TWh (~0.5% of world) |
| LBNL | 2023 | United States | ~176 TWh | Reconciles with IEA/EPRI band |
| IEA | 2030 | United States | ~426 TWh | ~half of US demand growth this decade |
| Goldman Sachs Research | 2030 | World capacity | +160–165% | Vs 2023; MW, not TWh |
Read the units. Goldman is often talking capacity (how fat the plug is). IEA is talking energy (how much actually flowed). A campus that is “2 GW” on a press release is not 2 GW × 8,760 hours unless it runs flat-out, which new AI halls increasingly do. Utilization is the hidden multiplier.
Training is a spike. Inference is the bill.
Training GPT-class models is still a brutal, concentrated event: thousands of accelerators, weeks to months, gigawatt-hours in a single job. It is also episodic. The IEA’s modeling says the growth that actually moves the global total is accelerated servers used for AI workloads, “predominantly inference,” growing ~30% a year and accounting for almost half of the net increase in data-center electricity between 2024 and 2030.
MIT, Epoch, and a string of 2025–2026 papers converge on the same split: once a model is deployed to hundreds of millions of people, serving it dwarfs the training run that created it. Some industry estimates put 80–90% of AI compute on inference. That is why “how much did GPT-5 cost to train?” is a magazine question and “what does a 400-million-user assistant draw at 7 p.m. in Virginia?” is a grid question.
| Workload | When it happens | Why it matters to a grid |
|---|---|---|
| Frontier training | Weeks–months, a few times a year per lab | Local spike, easy to name, easy to over-weight |
| Fine-tunes / post-train | Continuous inside labs | Smaller than pretrain, larger than a demo |
| Text inference | 24/7, follows human time zones | The volume term; efficiency gains get eaten by more tokens |
| Reasoning / agents | Bursting, 2025–26 growth | 10×–100× a short chat; this is the new load |
| Image, video, voice | Anytime a product ships multimodal | Orders of magnitude above text; still under-counted in “query” PR |
What one query actually costs
A conventional Google search is often cited around 0.3 watt-hours. In 2024, several estimates put a ChatGPT-class text query near 2.9 Wh—about ten times a search. By 2025–26, median energy per short text query had fallen toward 0.24–0.3 Wh on newer measurements, because models got smaller per token, batches got better, and routers stopped sending every prompt to the largest brain in the building.
That looks like a win until you read the asterisks. Long reasoning traces, tool-using agents, and “think for 30 seconds” modes can land an order of magnitude higher. Image and video generation are another sport. And almost none of the consumer-facing figures include: (1) the training amortization, (2) idle GPUs kept hot for latency, (3) cooling and power-conversion overhead (PUE), or (4) the network to the hall. Google’s published fleet PUEs cluster around 1.06–1.14. A 1.10 PUE means the “query energy” you were quoted is missing about 10% before you even get to water.
| Action | Ballpark electricity | What is usually excluded |
|---|---|---|
| Web search | ~0.3 Wh | Ads stack, ranking trains |
| Short LLM text query (newer median) | ~0.24–0.3 Wh | Idle capacity, PUE, training |
| Older GPT-class text query (2024 cites) | ~2.9 Wh | Same, plus fatter models |
| Long reasoning / agent loop | ~several to tens of Wh | Tool calls, retries, extra decode |
| Image generation | tens–hundreds of Wh | Varies wildly by resolution and steps |
| A “this is like a Google search” claim | Marketing | Ask for the four exclusions above |
Geography is the actual energy story
Global percentages soothe. Substations do not. IEA: the United States used about 45% of 2024 data-center electricity, China 25%, Europe 15%. Nearly half of US capacity sits in five regional clusters. Northern Virginia, Dallas–Fort Worth, Phoenix, the Columbia River, and a handful of Midwest counties are not “the cloud.” They are towns with interconnect queues and county hearings.
Ireland is the cleanest national picture because the Central Statistics Office publishes it. Data centers used 7,663 GWh in 2025, about 23% of Irish electricity—up from roughly 5% a decade earlier. Households still used more (~28%), but IEA-linked commentary has discussed a path toward a third of the Irish system later in the decade. Singapore has already lived through moratoriums. The Netherlands has paused campuses. Virginia’s data-center load has been estimated in the mid-20s TWh and, in some statewide prints, more than one kilowatt-hour in four.
| Place | Why it shows up in hearings | Published marker |
|---|---|---|
| United States (national) | ~45% of world DC electricity | IEA 2024 share; 2030 ~426 TWh |
| Northern Virginia | Density, not just MW | Five-cluster US pattern; local peaking on water and power |
| Ireland | National grid, not a county | 7,663 GWh in 2025; ~23% of electricity |
| China | ~25% of world DC electricity | IEA 2024; a lot of it in water-stressed basins |
| Singapore / Netherlands | Land, water, politics | Moratoria and permit fights, not TWh headlines |
| Australia NEM | Fast percentage growth from a small base | AEMO: 34 TWh by 2035–36 in one projection (~13% of the market) |
Water is the quieter constraint
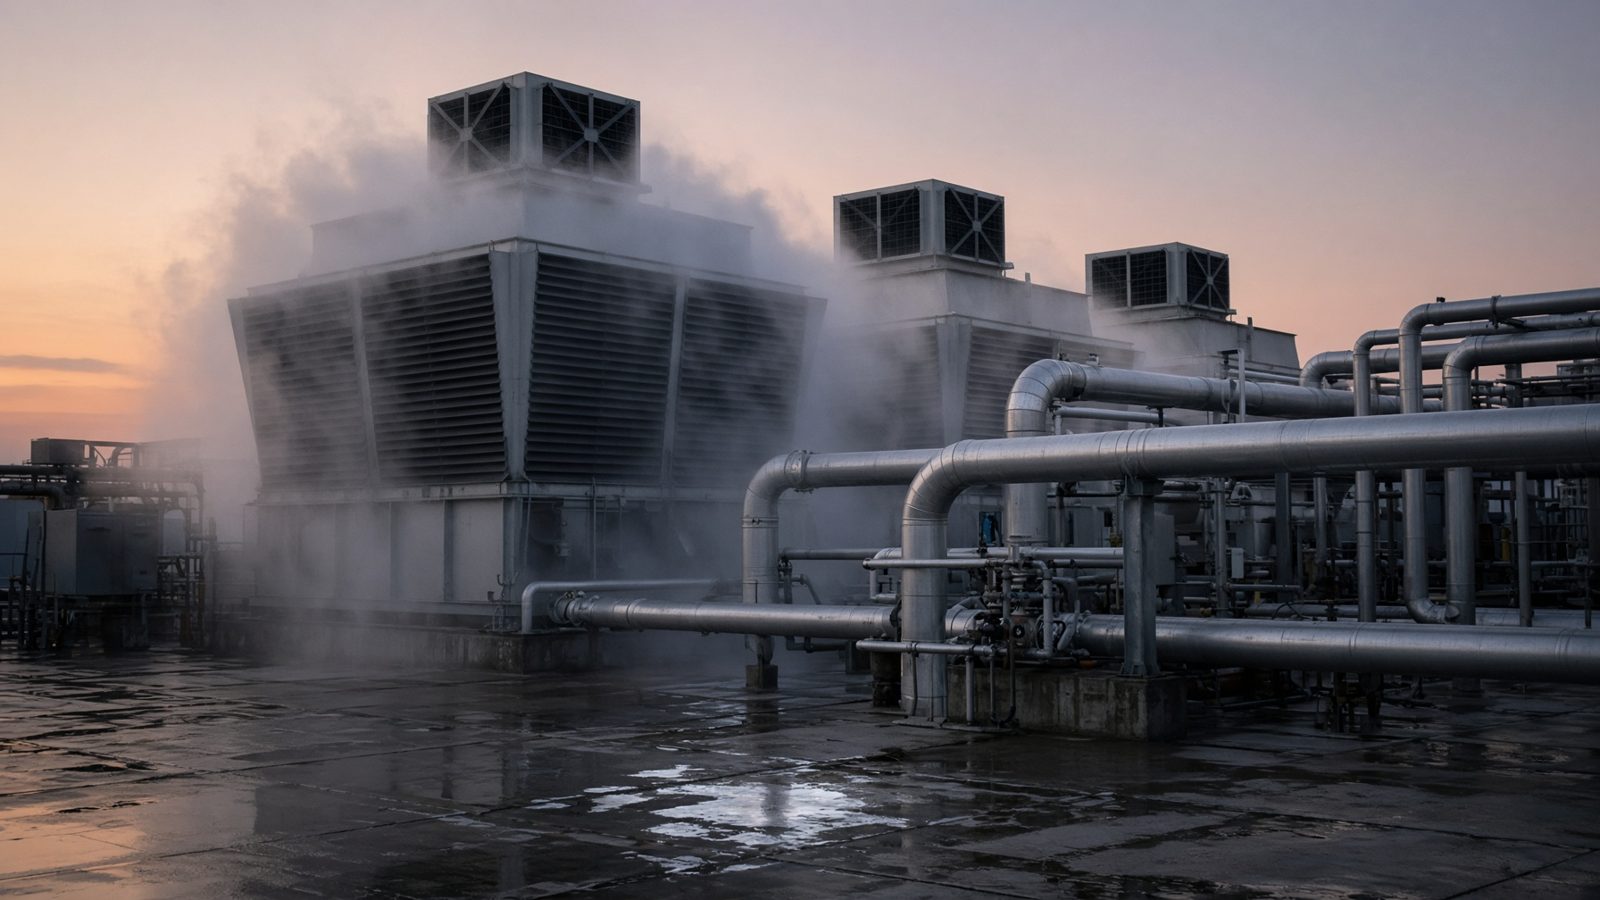
Electricity gets the bar charts. Water gets the lawsuits. Hyperscalers’ reported water use jumped tens of percent year-over-year in 2024–25 at more than one firm. Direct on-site cooling is still smaller than the water embedded in the electricity itself—but siting has historically optimized for power, fiber, and land, then discovered the aquifer later.
A 2026 review of the water-feedback loop is blunt: data centers evaporate 70–90% of the water they withdraw, versus roughly 12% for a typical public supply. Peaking factors of 3 to 30 blow through pipes sized for houses. Northern Virginia’s Potomac-basin work has put data-center consumptive use in the range of about 9–12% of regional consumptive use on hot days. Uruguay and Chile have already forced redesigns or permits back. Ireland’s bind is electricity first, water second; Phoenix and parts of the US West are the reverse.
If a campus promises “we recycle water,” ask two follow-ups: makeup water on a 40°C day, and whether the power plant upstream is wet-cooled. The second number is usually larger.
Efficiency is real. Volume is winning.
Performance per watt on accelerators has risen fast. Google says 2025 data centers delivered more than three times the compute per unit energy than five years earlier, largely from TPUs. PUE at well-run halls is already so low that squeezing it further is not the lever. The lever is tokens, images, and agents. Efficiency gains per token are being eaten by more tokens. That is Jevons with a product manager attached.
IEA’s generation mix for the power feeding data centers is still fossil-heavy in the current snapshot (on the order of ~60% fossil, ~27% renewables, ~15% nuclear in one 2025 breakdown). Corporate PPAs move the accounting. They do not always move the local peak. A 24/7 AI hall that “matches” annual wind is still a gas-turbine problem at 6 p.m. in Loudoun County unless the matching is hourly and additional.
How to read the next press release
When a lab says a query is “as small as a search,” ask:
- Is this a short text completion, or a reasoning / multimodal call?
- Does it include PUE, idle GPUs, and the network?
- Does it amortize training—and over how many queries?
- Is the denominator a median, a marketing best case, or a p95?
- Where, physically, does the watt land? A national average hides Virginia and Dublin.
The honest unit for public debate is not “one ChatGPT question.” It is TWh on a named grid, in a named year, with a named scope (IT load vs facility vs AI-only). The IEA 415 → 945 TWh path is the least-wrong global picture we have. The Irish 23% and the US 426 TWh-by-2030 prints are how that picture becomes politics. Training runs will keep making better headlines. Inference will keep showing up on the bill.
What the spreadsheets still will not say
Three gaps keep this from being a single dashboard. First, most operators still report “data center” rather than “AI” as a line item, so every AI-only TWh is a modeled slice. Second, interconnection queues mix speculative campuses with steel in the ground; treating the queue as demand overstates 2026 and understates the fight over who gets the next transformer. Third, water and land-use impacts are almost never in the same table as TWh, which is why a campus can look efficient on PUE and still lose a permit. Until those three close, the grown-up move is to publish ranges, name the source, and refuse a slogan.
Sources
- International Energy Agency, Energy and AI — Energy demand from AI (415 TWh in 2024; ~945 TWh in 2030 base; accelerated servers ~30%/yr).
- IEA, Energy and AI — Executive summary (US 45%, China 25%, Europe 15%; ~1,200 TWh in 2035 base; US 2030 data-center use vs heavy industry).
- Lawrence Berkeley National Laboratory, 2024 United States Data Center Energy Usage Report (~176 TWh US in 2023).
- Our World in Data, How much energy do data centers and artificial intelligence use? (2025 world ~485 TWh; AI-focused ~155 TWh / ~0.5%).
- Goldman Sachs Research, AI to drive 165% increase in data-center power demand by 2030.
- Brookings, Global energy demands within the AI regulatory landscape (2026), synthesizing IEA / Deloitte / inference share.
- Washington Post climate desk reporting on query-level watt-hours (search ~0.3 Wh; 2024 GPT-class ~2.9 Wh; later medians ~0.24–0.3 Wh).
- Ireland Central Statistics Office / grid reporting on 2025 data-center electricity (7,663 GWh, ~23% of national use).
- Google, Data center efficiency / PUE (fleet PUEs and compute-per-watt).
- Han et al. and related 2024–26 water-system papers on consumptive ratios (70–90%) and peaking (summarized in the 2026 arXiv review of the water-use feedback loop).
Updated August 2026. Figures are the public range, not a private census. Labs still do not report AI load as a clean line item on every grid. Where sources disagree, we show the range and name the unit.
Unit: %
IEA Energy and AI executive summary. Nearly half of US capacity sits in five regional clusters.
Unit: %
Ireland CSO / grid reporting. 2025: 7,663 GWh. Homes still use more, but the gap is closing.
Unit: Wh
Search ~0.3 Wh. Some 2024 GPT-class estimates were ~2.9 Wh. Newer medians fell toward 0.24–0.3 Wh; long reasoning and video are another decade.
Unit: TWh
LBNL / IEA / EPRI band for recent years. IEA 2030 US figure ~426 TWh. Nearly half of US demand growth to 2030 is compute.
More from the desk

How to Make an AI Girlfriend: The Actual Build Order
Appearance last. Personality first. Scenario as the memory spine. Then voice, memory, and who actually keeps her. A 2026 build order for Candy, Character.AI, CrushOn, and Nomi — including the free path.
22 min read

Who Owns the AI Character You Just Built?
You spent a night on her. You probably do not keep her. Character.AI, Candy, SpicyChat, Nomi, CrushOn — who actually owns the AI girlfriend you just built, in the terms they already published.
17 min read
Best AI girlfriend apps in 2026
Character.AI, Kindroid, SpicyChat, CrushOn, Replika, Chai, Talkie, Muah, Candy, and Nomi — grouped by what they actually do, with live pricing caveats.
4 min read